


Sale Funnel tools and insights

Sales Funnel is a visual interactive tool that demonstrates the process from leads to closed sales.
The Sales Funnel is extremely useful in providing insight into any process that involves a series of conversion ratios.
For example: the inflow of enquiries and conversion stages to eventual inflow of actual orders.
In other words, the purpose of the Sales Funnel is to determine performance ratios between the identified stages of your customer’s journey.
Below we examine the different types of sales funnel and how they provide insight into sales performance and increased opportunities.
Note that you would still be running separate conversion charts for sales. The Sales Funnel is designed to provide an overview of conversion stage effectiveness.
The Sales Funnel can also be adapted to examine any process that involves a conversion element. For example: a Purchasing Funnel to examine the performance of the buying function within the business.
Making the Sales Funnel an active tool
You will find many conceptual Sales Funnel examples online. The information below illustrates and explores more detailed Sales Funnels and how they can be an active part of your sales and marketing activities.
There is nothing wrong in experimenting with different versions of Sales Funnels depending on the focus you are placing on your activities.
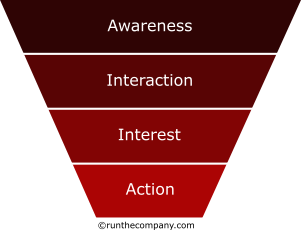
Conceptual Sales Funnel
This version of Sales Funnel is often found in marketing textbooks. It is designed to illustrate the conceptual process of marketing and advertising and is not overly useful for detailed conversion data analysis or deciding data specific actions.
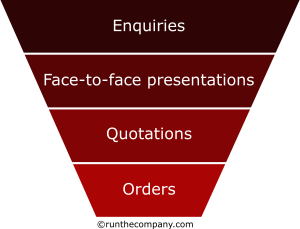
Business to Business Sales Funnel example
The Sales Funnel example below is for a business-to-business company. The stages from initial enquiry to actual order are kept simple and therefore best illustrates the application of data.
Data applied Sales Funnel: Example Quarter 1 data
This Sales Funnel now includes actual data for the first quarter of the year.
Quantifying each stage of the Sales Funnel brings the whole process to life.
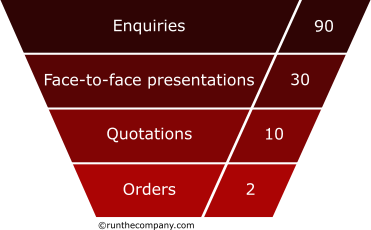
What does this example tell us
Enquiry to face-to-face presentation ratio:
This company may normally expect a sizeable drop from enquiry to face-to-face presentation.
This could be due to duplicated contract enquiries (more than one customer enquiry for your product for the same down-the-road contract).
There may also be a delay between initial enquiry to meeting which means the data will drift over the Sales Funnel quarters. This is not a problem in the longer term because the trends will not be affected unless there is a seasonal element.
Face-to-face to quotation ratio:
In this example, a one third conversion from presentation to actual quotation may indicate an active variable or two.
For example: there may be competition activity, the presentation may be too general and not closing to next action, or simply miscalculating its propositions.
The visiting sales team may also be less effective for whatever reason.
Quotation to Order ratio:
This illustrates the biggest conversion ratio drop and should attract attention. Action may be required to rectify the issue.
There may be a price issue or the quotation pack may not be reminding the buyer of why you.
The business may be tendering to simply make up the numbers; or there may be a lot of delayed or cancelled projects indicating a recession in your sector. Seek the truth.
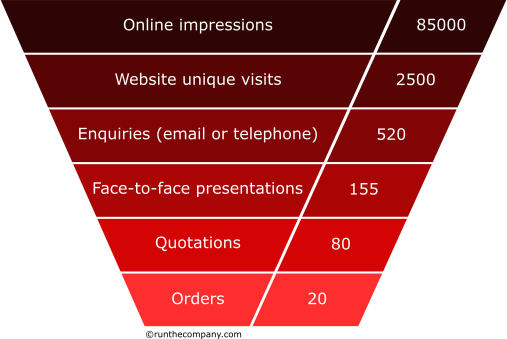
Below is an expanded version of the business-to-business example.
This Sales Funnel focuses on conversion ratios from online performance to sales.
The interesting aspect of this Sales Funnel is the forcing of marketing activities (in this case online marketing activities) to be part of the sales conversion process.
Each marketing activity must play an active and defined part in delivering the ka-ching of the cash till.
In other words, the Sales Funnel is a useful way to determine the pieces of string between an activity and results – in this case from online impressions to money in the bank.
It’s not exact and other variables can leak into the logic of the Sales Funnel; but it does present collations that over time can enable activities to be tested, evolved and improved.
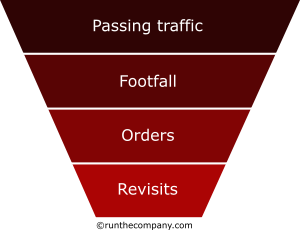
High street retail Sales Funnel example
This example considers the conversion ratio segments between passing traffic and eventual orders and return visits to the shop in the form of habitual customers.
Spotting Anomalies and taking action
Keeping a file of Sales Funnel data will highlight any Anomalies and enable you to take action.
For example if the percentage conversion from quotation to close suddenly drops then your competition may have dropped its prices.
Working the Trends to your advantage
The Sales Funnel log will also indicate trends towards success; suggesting increased market activity or market penetration.
Likewise, where trends are in the opposite direction then this will indicate or confirm falling market activity or market share.
Whether it is Anomalies or Trends that are causing the issue, the Sales Funnel provides the ability to focus on a specific conversion stage and enables you to take focussed actions to improve or take advantage of situations.
Although there are many ways to apply the Sales Funnel tool, these examples always point to the final sales order. In most cases this is crucial. In business, we do things to get the sales order.
E-commerce Sales Funnel examples
This example explores the sales ratio of an e-commerce shop: from online impressions down to actual orders received on the website.
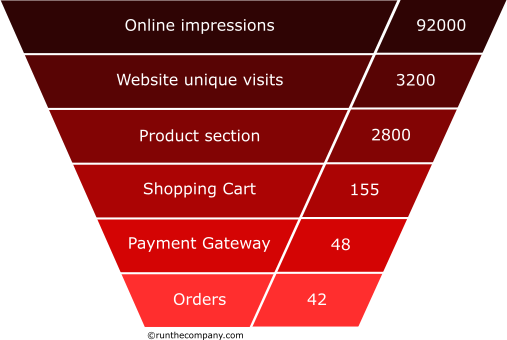
Online Impressions to Website Unique Visits ratio:
Impressions data gathered from all your search engine, social media and PPC campaigns will provide a total for all online Impressions.
Remember that the Sales Funnel analysis is a conclusion of your activities and not an analysis of individual campaigns or projects.
For example, you would monitor a PPC campaign separate from the Sales Funnel, although its result will contribute to the Sales Funnel shape.
This ratio considers the performance of Impressions to a point. The data may be corrupted by direct visits but direct visits may have been in consequence to Impressions. Marketing data analysis is not an exact science but it is a torch with just enough light to guide us down the right road.
Product Section Visits to Shopping Cart ratio:
This ratio considers visits to the product section on your website to the Shopping Cart.
There are many variables that influence this ratio and the objective should be to constantly strive to improve the ratio to your favour or take actions when the ratio drifts against you.
Here are a just a few variables that can influence this ratio: badly designed website, wrong products to visitor profile, uncompetitive pricing.
The great thing about this Sales Funnel is that it has separated the Impressions performance from Basket Clicks in that the internal performance of the website can be assessed separately from the performance of online Impressions. (Unless of course your impressions are badly profiled and subsequent visits are off-target.)
Shopping cart to Order ratio:
This is an important ratio and an issue for many e-commerce retailers.
If you think of how much money, time and effort has been invested to get a prospect to the Basket then if there is a drop out issue then this requires attention.
The problem might be ergonomic and testing different design options might provide a clue.
This is called split testing. For example, “delivery price” information provided to visitors early on might improve this ratio but at the cost of the Visits to Basket ratio further up the Sales Funnel.
What to do with Sales Funnel results
Presenting Sales Funnel data at monthly sales and management meetings will stimulate discussion and confirm or question current strategy and activities.
Over time, the differences between the current and previous Sales Funnels will highlight changing trends and improvements within the different ratios.